Electrify Chicago
An independent tool for viewing City of Chicago building data
According to the
2022 Chicago Climate Action Plan,
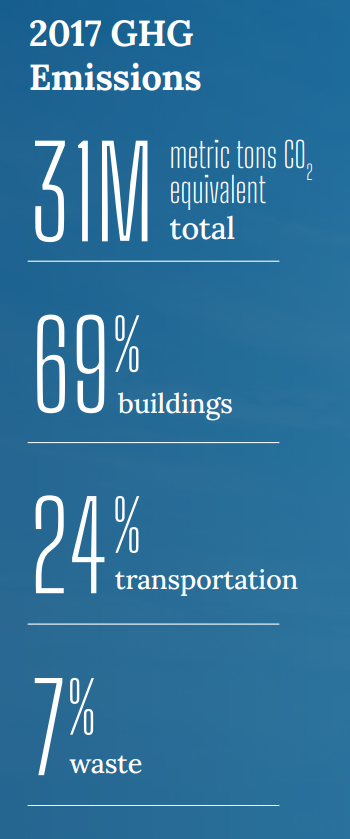
69% of Chicago's emissions come from buildings, making
building emissions our biggest challenge and our biggest opportunity as a city
to tackle climate change. At Electrify Chicago, we showcase building performance using
publicly available data supplemented by community-submitted photographs and building
owners.
Start by looking at Chicago's buildings with the highest greenhouse gas intensity i.e. emissions per square foot. Large, efficient, buildings can perform much better than very inefficient small buildings on this metric.
New Article
📰 $30 Million In Missed Fines
The City Of Chicago failed to collect $30 million in potential fines from the building benchmarking ordinance, reducing transparency and accountability.
Legislative update! 🎉
As of late January 2024, legislation is being introduced to require new use more efficient forms of water and space heating, via the Clean And Affordable Buildings Ordinance (CABO), which will reduce the number of highly polluting and inefficient buildings that end up on this site.
If you're in Chicago,
write to your alderman to support the CABO!
Chicago Buildings by Greenhouse Gas Intensity
Note: Data includes large Chicago buildings with data from 2022, unless explicitly stated otherwise.
Note: This data only includes buildings whose emissions are reported
under the
Chicago Energy Benchmarking Ordinance. According to the City “As of 2016,
this list includes all commercial, institutional, and residential buildings larger than
50,000 square feet.” This dataset is also then filtered to only buildings with
reported emissions > 1,000 metric tons CO2 equivalent.
The latest year of data is from 2022, but we update the site regularly when new data is available, and some buildings may have failed to report that year, and only have older data available.
| Property Name / address | Primary Property Type |
Greenhouse Gas Intensity (kg CO2 eq./sqft) |
Total Greenhouse Emissions (metric tons CO2 eq.) |
|---|---|---|---|
|
Fifth Praire Shores, LLC
2801 S King Dr
| Multifamily Housing | 8.4 kg/sqft
Highest 22%
| 2,420 tons
Highest 18%
|
|
Renaissance Chicago O'Hare Suites Hotel
8500 W Bryn Mawr Ave
| Hotel | 8.4 kg/sqft
Highest 22%
| 2,651 tons
Highest 16%
|
|
Home Depot, #1980 Kimball & Addiston
3500 N Kimball Ave
| Retail Store | 8.4 kg/sqft
Highest 22%
| 916 tons
Highest 49%
|
|
30 E DIVISION ST
30 E DIVISION ST
| Multifamily Housing | 8.4 kg/sqft
Highest 22%
| 605 tons
Lowest 34%
|
|
2314 N LINCOLN PARK WEST
2314 N LINCOLN PARK WEST
| Multifamily Housing | 8.4 kg/sqft
Highest 22%
| 803 tons
Lowest 46%
|
|
Lake Shore Tower Apartments
5600 N SHERIDAN RD
| Multifamily Housing | 8.4 kg/sqft
Highest 22%
| 1,034 tons
Highest 44%
|
|
Four40
🚩
440 S LaSalle St
| Office | 8.4 kg/sqft
Highest 22%
| 10,339 tons
Highest 2%
|
|
200 West Partners Limited Partnership
330 S Wells St
| Multifamily Housing | 8.4 kg/sqft
Highest 22%
| 819 tons
Lowest 47%
|
|
303 E Wacker
303 E Wacker
| Office | 8.4 kg/sqft
Highest 22%
| 8,584 tons
Highest 3%
|
|
Presidents Plaza 1
8600 W Bryn Mawr Ave
| Office | 8.4 kg/sqft
Highest 22%
| 3,503 tons
Highest 11%
|
|
First Praire Shores, LLC
2901 S King Dr
| Multifamily Housing | 8.4 kg/sqft
Highest 22%
| 2,442 tons
Highest 18%
|
|
Richard Henry Lee Elementary School
6448 S Tripp Avenue
| K-12 School | 8.3 kg/sqft
Highest 23%
| 471 tons
Lowest 23%
|
|
Mansueto High School
🕰️
2911 W 47Th St
| K-12 School | 8.3 kg/sqft | 555 tons |
|
The Hensley
🕰️
707 N WELLS ST
| Multifamily Housing | 8.3 kg/sqft | 748 tons |
|
Fourth Presbyterian Church
126 E CHESTNUT ST
| Worship Facility | 8.3 kg/sqft
Highest 23%
| 1,355 tons
Highest 35%
|
Data Source:
Chicago Energy Benchmarking Data
